Information
Council Tax Consultation Results 2023/24
Budget Consultation February 2023
Background
Northamptonshire Police, Fire and Crime Commissioner, Stephen Mold, has responsibility for setting the budget for Northamptonshire Police and Northamptonshire Fire and Rescue Service. Police and fire funding is made up of a mixture of government grants and money from local taxpayers.
Just 18% of the council tax residents pay in Northamptonshire comes to the PFCC to pay for policing and fire services: the rest of the council tax goes to the local authorities.
Northamptonshire is one of the fastest-growing places in the country and our population has increased much more than the national average, but government funding for police and fire services has not kept pace with this change.
This year, the financial picture is uncertain and it is anticipated that the cost of inflationary increases will be more than the funding available from the government. The challenge for us is to find ways of sustaining the improvements in local services that we have made and meet the priorities for further improvement.
Methodology
The public were invited to tell us their views and we launched this budget survey to ask whether they would pay more for the services provided by policing and the fire service – responses will be taken into account by the PFCC in deciding the level of council tax precept to ask residents to pay towards police and fire services in Northamptonshire next year.
An online survey was conducted from December 2022 – January 2023.
1734 people engaged with the survey, giving a representative sample of the county at a 99% confidence level and 4% margin of error.
This information is also available as a pdf to view or download here: Council Tax Consultation 2023_24 Results
Northamptonshire Fire and Rescue Service
Fire currently makes up approximately 4% of your Council Tax bill and the average household (band D) pays £68.20 a year (approximately £1.31 a week) towards Fire and Rescue Services. This is the second lowest amount paid in the country and is well below the national average. Whilst below inflation, an increase of £5 a year (7.3%) will enable the essential equipment replacement programme and firefighter recruitment to continue. There will still be a financial shortfall for 2023/24 for which savings will need to be made and Fire will continue to work with Police to share services and buildings wherever possible.
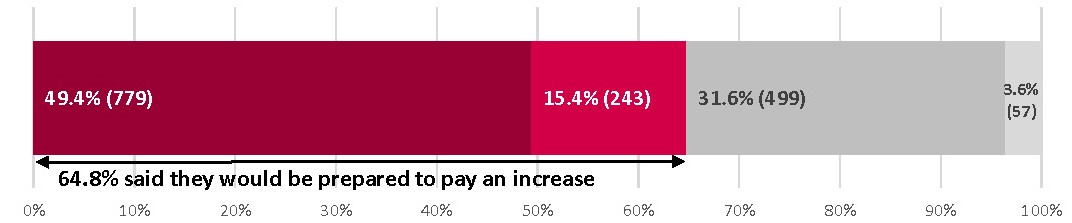
- In light of this, which one of the following statements best represents your views? (n=1,578)
49.4% (779) I would be prepared to pay an increase of £5 a year for Fire & Rescue services (approximately 10p per week)
15.4 % (243) I don’t think the Fire & Rescue services are funded enough in Northamptonshire and I would be prepared to pay more
31.6% (499) I would not be prepared to pay any more for Fire and Rescue Services than I do now
3.6% (57) I don’t know
64.8% of people said they would be prepared to pay an increase
- In your opinion, how good of a job do you think Northamptonshire Fire and Rescue Service are doing? (n=1,563)
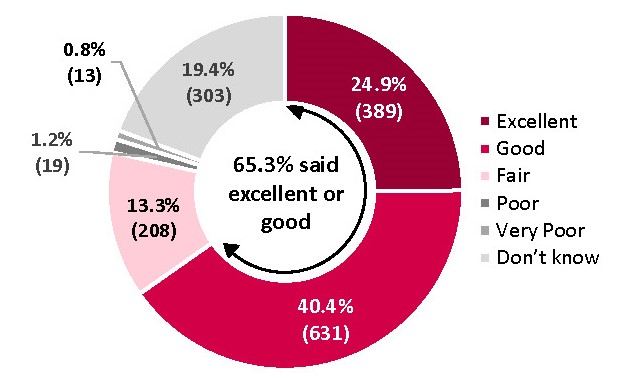
24.9% (389) Excellent
40.4% (631) Good
13.3% (208) Fair
1.2% (19) Poor
0.8% (13) Very Poor
19.4% (303) Don’t know
- Why do you say that? (n=687)
The most common themes to impact people’s judgement were…
I’ve had no interaction with fire (179 comments, 26.1%)
“I have no experience of Fire and Rescue services on which to form an opinion.”
No reason to think badly (32 comments, 4.7%)
“I have no reason to doubt that they are doing a good job.”
They are responsive/ provide a good service (within constraints of funding) (163 comments, 23.7%)
“They do very well on the limited resources they have.”
“They are a first class service.”
They do dangerous work (25 comments, 3.6%)
“Anyone who is willing to put there life on their line as part of their job for someone they have never met can’t get spoken of highly enough.”
No figures published/ I have no knowledge (59 comments, 8.6%)
“More advertisement across various channels would help so we know what they’re up to”.
“I don’t really see much about the work they do its not promoted well”.
They should do more (22 comments, 3.2%)
“A service that could be better used.”
“Most stations are underworked spending most of their time on standby.”
Good experience with them (or heard good things) (58 comments, 8.4%)
“Responded to a recent incident that I called in immediately and extinguished the fire quickly and safely while being professional.”
Good media (21, 3.1%)
“From all the good stuff I see online.”
Other, less frequent themes included:
- Good public relations/visibility
- Need for more resources/recruitment
- Doing good prevention work
- Lack of visibility
- Have you got any further comments you would like to make about Northamptonshire Fire and Rescue Service? (473 people provided answers)
12.3% said no to this question.
They provide a good service (100 comments, 21.1%)
“They do an excellent job. I have nothing but respect for them”.
“Having relied on the efforts of the firemen and women to save my house. They would have my complete support”.
“A good service with respect and great public relations”.
“You do a great job, thank-you.”
Cost of living crisis – wrong time to ask people to pay more (53 comments, 11.2%)
“Do you not know there is a “Cost Of Living” crisis.”
“Though they do a good job I am already at breaking point and are worried about how I am going to afford everything next year.”
“People are really struggling. DO NOT RAISE IT this year. Tighten your belts like the vast majority of population have to in this financial climate.”
“This is inappropriate due to the increase in food prices, energy prices etc.”
I would pay more/ we should pay more if we can afford (45 comments, 9.5%)
“I believe they do an excellent job but are severely underfunded and I would be willing to pay more so they get the best equipment for the job and to pay them better wages.”
“I believe that an annual increase of £5 is fair to ensure that the Northamptonshire Fire and Rescue Service can continue to serve the community.”
“Agree very strongly that fire needs more budget.”
Make savings elsewhere/ cut inefficiencies (30 comments, 6.3%)
“The current budget could be spent more wisely.”
“The whole fire/rescue, ambulance services need to be completely changed, what we have today are great inefficiencies.”
“As with the police, I would prefer to see efficiencies made in these services rather than asking for more money. By efficiencies I mean limiting high level salaries, reducing administrative inefficiencies and prioritisation on spending – not cutting back on ground level staff.”
More government funding/ underfunded service (30 comments, 6.3%)
“The Government need to do better and properly support our Emergency services. The general public can not continue to foot the bill.”
“This should be funded by government. Our personal costs are rising to much.”
“NFRS is terribly funded. More investment is needed to boost the Service to equal surrounding counties. Risks are increasing but the same tired equipment is expected to cope. This will not work. We need substantial investment from central government to restore the status quo.”
No interaction/ haven’t needed (but want to be good in case) (25 comments, 5.3%)
“I have had no interaction with this service so have no further comments.”
“It’s something we hope we never need but if we do we all want the best.”
“Fortunately, I haven’t needed the Fire Service.”
“It’s like an insurance policy. We pay for the service but hope we never have to use it. When they are needed they always respond as quickly as possible.”
Need to be doing more while on shift/ assist health service (18 comments, 3.8%)
“They need to be playing a greater role 24/7. There can no longer be any justification for firefighters to sleep during their shits when other emergency workers are working flat out.”
“The Fire service should be far more flexible with their role as per other countries, their skill set could be expanded to provide a better public service.”
“Assist ambulance more with medical emergency’s not just on call staff.”
“Using fire services as community fire responders costs money and allows the ambulance service to get away with providing a poor service”
Negative comments about Northamptonshire Fire and Rescue Service (18 comments, 3.8%)
“We have had several arson attacks in this part of Northamptonshire fire brigade struggle to deal with it.”
“A poor example of how wasteful and poorly run an organisation can be.”
“Fire are just reactive and rarely productive.”
Other, less frequent themes included:
- People do not want to pay more/ think they pay enough
- Negative comments about the PFCC
- Pay fairly (especially lower pay grades)
Northamptonshire Police
Police currently makes up approximately 14% of your Council Tax bill and the average household (band D) pays around £278.04 a year (approximately £5 per week) towards policing. Whilst below inflation, an increase of £15 a year (5.3%) would enable us to reach 1500 police officers and sustain that number for as long as possible. There will still be a financial shortfall for 2023/24 for which savings will need to be made and Police will continue to work with Fire to share services and buildings wherever possible.
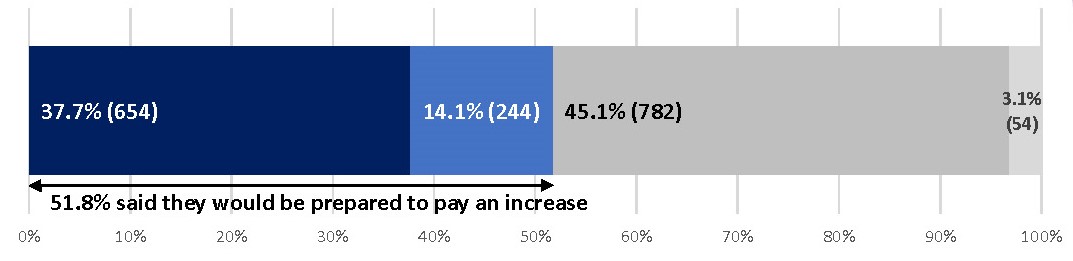
- In light of this, which one of the following statements best represents your views? (n=1734)
37.7% (654) I would be prepared to pay an increase of £15 a year for policing (approximately 29p per week)
14.1% (244) I don’t think the Police are funded enough in Northamptonshire and I would be prepared to pay more
45.1% (782) I would not be prepared to pay any more for policing than I do now
3.1% (54) I don’t know
51.8% of people said they would be prepared to pay an increase
- In your opinion, how good of a job do you think Northamptonshire Police are doing? (n=1,612)
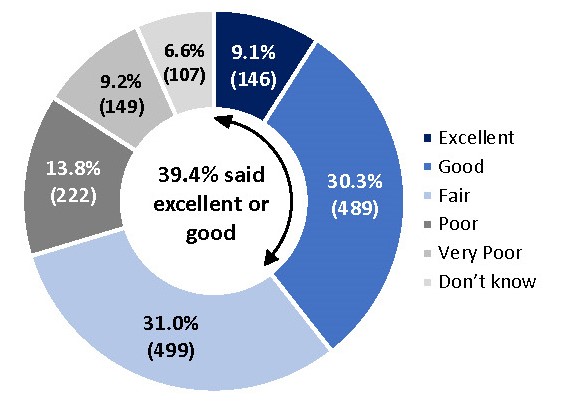
9.1% (146) Excellent
30.3% (489) Good
31% (499) Fair
13.8% (222) Poor
9.2% (149) Very Poor
6.6% (107) Don’t know
- Why do you say that? (n=1073)
The most common themes to impact people’s judgement were…
Visibility/Presence (mentioned by 18.0% of people)
“There is no police presence on the streets.”
“I hardly ever see a policeman.”
“I don’t see enough officers just out and about.”
Police do not take enough action (mentioned by 14% of people)
“Too many crimes are not being investigated.”
“Hardly respond or deal with reported crime.”
“The police never come out when you need them.”
The police do a good job despite challenges (mentioned by 8.4% of people)
“The police don’t have the manpower but do an excellent job with the resources they have.”
“There generally doing a good job but have limitations.”
“Our local PCSO’s do a grand job, are readily available and regularly broadcast concerns, crimes, etc.”
Personal experience (good and bad) (mentioned by 8.2% of people)
“Only needed them twice and no response.”
“I’ve had mixed responses, one good and the other awful.”
“When I have needed them they have been excellent.”
Police need more funding/resources (mentioned by 6.8% of people)
“You are clearly underfunded and thin on the ground.”
“You don’t have the resources to do better.”
I’ve had no interaction with the police (mentioned by 4.6% of people)
“Had no dealings with them.”
“I have not had to contact them for anything.”
Other, less frequent themes included:
- Motorists being targeted too much
- And in contrast, a need for more roads policing enforcement
- Being kept well informed by news/communications
- A need for more foot patrols
- A need for more rural policing
- Being unaware of statistics
- More needing to be done about lower harm crime that impacts communities
- Crime having increased, but also people saying crime has decreased
- Response times
- Have you got any further comments you would like to make about Northamptonshire Police? (756 people provided answers)
Low visibility /presence (11 comments, 14.7%)
“Can we then see some Police officers out and about.”
“Would like to see a policeman occasionally.”
“They seem to be invisible!!!”
“I do not get a service from Northants Police and no visibility.”
I can not afford an increase (cost of living/bills) (93 comments, 12.3%)
“I would love to be able to tick the next box as I think the police are under funded. However I need to be realistic with what I can afford. Being a single parent on a low income.”
“Cost of living is high at this time and not appropriate to ask people for more money at this time.”
“They are under similar inflationary pressures as are we all – but few of the public get income increases to match inflation.”
Make savings/ manage money better (67 comments, 8.9%)
“The country is having to manage in a cost of living budget which means making what we have go further or targeting the things we can and cannot do – the Police and council need to do the same and manage with the same or less funds than they have before.”
“There is so much unnecessary bureaucracy. If practices were streamlined to reduce all this activity that adds no benefit then you would have far more effective officers.”
“Cut back on waste”.
Police do not take enough action/ need to tackle crime better (63 comments, 8.3%)
“Yes, when are you going to prosecute criminals or even attend crime when called? As for the CPS do not get me started!”
“Police are no longer visible in the community and don’t seem to care about burglaries, car theft etc. They only give out a reference number. Not acceptable.”
“Police not willing to follow up on reported crime even though witnesses were available.”
Police do a good job (43 comments, 5.7%)
“They all do a fantastic job and deserve every penny, they are not being paid nowhere near enough for what they do.”
“You do a great job under difficult circumstances.”
“Absolutely first class, always been there when we needed them…worth their weight in gold.”
“Northamptonshire Police come across to me as efficient, well led and courteous.”
I would pay more/ they deserve more (25 comments, 5.3%)
“I would be prepared to pay an inflationary increase for Northants Police (over 10%).”
“If we better fund the police and tackle crime better, then our economy would be all better for it. So I am happy to spend much more as an investment to stop criminals.”
“I’m happy to pay more so that there are more police officers to help keep crime down.”
“100% agree with extra funding for the police & fire service.”
More government funding (39 comments, 5.2%)
“With the cost of living impacting everyone-the gov should provide the shortfall in monies.”
“Need more money from central government.”
“The Government need to do better and properly support our Emergency services. The general public can not continue to foot the bill.”
Already put prices up last year (and not delivered on last promise) (30 comments, 4.0%)
“Last time Stephen Mould increased and promised us better policing, this is yet to be seen. Police don’t respond to majority of calls/ reported crime. Waste of money and inefficient.”
“We increased the percentage last time we were asked, it’s not viable to do back to back increases.”
Other, less frequent themes included:
- Negative comments about the PFCC
- too much focus on speeding/motorists
- rural areas need more policing
- we do not get value for money
- police do a bad job
- officers need to get out of cars
- need more officers, more stations/coverage
- bad personal experience
- address pay gaps
- more money would not help
Northamptonshire Police – Public Confidence
- How much would you agree or disagree that…
…taking everything into account I have confidence in the police in this area (n=1,587)
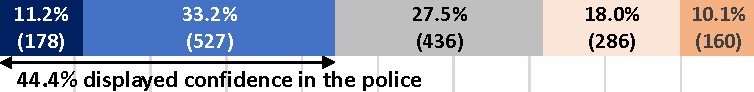
11.2% (178) Strongly agree
33.2 (527) Agree
27.5% (436) Neither agree nor disagree
18% (286) Disagree
10.1% (160) Strongly disagree
…the police in this area are dealing with the things that matter to people in the community? (n=1,584)
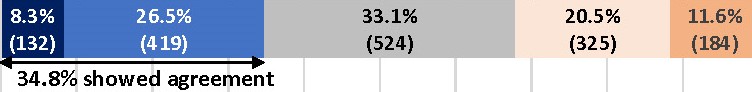
8.3% (132) Strongly agree
26.5% (419) Agree
33.1% (524) Neither agree nor disagree
20.5% (325) Disagree
11.6 % (184) Strongly disagree
…the police in this area understand the issues that affect this community? (n=1,583)
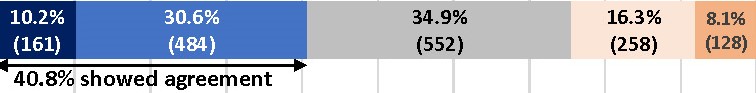
10.3% (161) Strongly agree
30.6% (484) Agree
34.9% (552)Neither agree nor disagree
16.3% (258) Disagree
8.1% (128) Strongly disagree
…the police in this area treat everyone fairly regardless of who they are? (n=1,588)
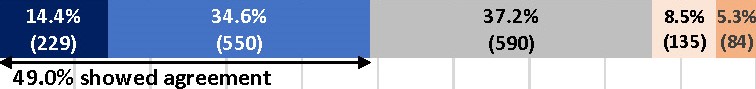
14.4% (229) Strongly agree
34.6% (550) Agree
37.2% (590) Neither agree nor disagree
8.5% (135) Disagree
5.3% (84) Strongly disagree
…the police in this area would treat you with respect if you had to contact them for any reason
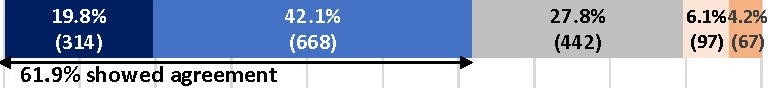
19.8% (314) Strongly agree
42.1% (668) Agree
27.8% (442) Neither agree nor disagree
6.1% (97) Disagree
4.2% (67) Strongly disagree
…the police in this area can be relied upon to be there when you need them? (n=1,595)
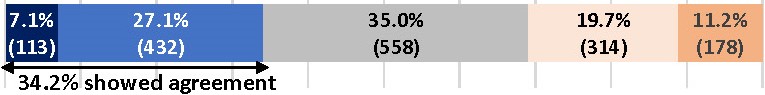
7.1% (113) Strongly agree
27.1% (432) Agree
35% (558) Neither agree nor disagree
19.7% (314) Disagree
11.2% (178) Strongly disagree
Survey Sample – Demographic Breakdown
1,734 people participated in the Council Tax Consultation.
1,500 completed the final question, giving a dropout rate of 13.5%.
A demographic breakdown of the people who participated in the survey:
- Gender (n=1,486)
57.5% (855) Male
34.3% (509) Female
7.7% (115) Prefer not to say
0.2% (3) Self-identify
0.1% (2) Non-binary
0.1 (2) Trans
- Age (n=1,497)
0.1% (2) aged 16-18
2.0% (30) aged 19-24
6.5% (97) aged 25-34
12.5% (187) aged 35-44
16.3% (244) aged 45-54
20.4% (305) aged 55-64
22.7% (340) aged 65-74
10.1% (151) aged 75+
- Disability (n=1,493)
16.6% (248) Disability
74.7% (1,115) No disability
- Ethnicity (n=1,498)
81.2% (1,217) White British
3.8% (57) White Other
0.7% (11) Mixed Ethnicity
0.5% (7) Black Background
1.4% (21) Asian Backgound
10.3% (153) Prefer not to say
2.1% (31) Other Ethnicity
- Religion (n=1,489)
45.0% (670) Christian
37.1% (552) No religion
1.2% (18) Pagan
0.8% (12) Buddhist
0.5% (8) Muslim
0.5% (7) Hindu
0.5% (7) Spiritualist
0.3% (4) Jehovah Witness
0.1% (2) Sikh
0.1% (1) Bahai
2.4%(36) Other religion
11.5% (172) Prefer not to say
- Sexuality (n=1,480)
80.1% (1,185) Hetrosexual
2.% (30) Bisexual
1.6% (24) Gay Man
0.5% (7) Lesbian/Gay Woman
0.3% (5) Questioning
2.0% (30) Other
13.5% (199) Prefer not to say
- Location of participants (n=1,499)
26.9% (403) Northampton
16.3% (244) East Northants
12.7 % (190) South Northants
12.1% (182) Kettering
11.6% (174) Wellingborough
10.2% (153) Daventry
7% (105) Corby
0.6% (9) Do not live in Northamptonshire
2.6% (39) Prefer not to say
- Do you work for Northamptonshire Police, PFCC or Northamptonshire Fire and Rescue Service? (n=1,500)
82.3% (1,234) No
8.3% (125) Northamptonshire Police
1.7% (26) Northamptonshire Fire and Rescue
1.3% (19) Northamptonshire PFCC
6.4% (96) Prefer not to say
- During the past 12 months have you been a victim of crime? (n=1,488)
78.5% (1,168) No
14% (208) Yes
7.5% (112) Prefer not to say
- Are you completing this survey as… (n=1,561)
97.3% (1,519) An individual
2.4% (38) A public sector organisation
0.3% (4) A private sector organisation
Survey Sample – Representativeness
The 2021 Census data shows the population of Northamptonshire is 785,200. This survey achieved a sample size of 1500 (completing the final question) which gives a representative sample of the whole population at a 95% Confidence Level and 3% Margin of Error.
| Unitary Authority | Census 2021 data | Survey sample | % Difference | Representativeness |
|---|---|---|---|---|
| North Northamptonshire | 45.8% | 47% | +1.2% | Fairly represented |
| West Northamptonshire | 54.2% | 49.8% | -4.4% | Slightly under-represented |
| Gender | Census 2021 data | Survey Sample | % Difference | Representativeness |
|---|---|---|---|---|
| Male | 49.4% | 57.5% | 8.1% | Over-represented |
| Female | 50.6% | 34.3% | -16.6% | Under-represented |
| Ethnicity | Census 2021 data | Survey Sample | % Difference | Representativeness |
|---|---|---|---|---|
| White British | 77.5% | 81.2% | +3.7% | Slightly over-represented |
| White Other | 10.4% | 3.8% | -6.6% | Slightly under-represented |
| Mixed Ethnicity | 2.6% | 0.7% | -1.9% | Fairly represented |
| Black Background | 4% | 0.5% | -3.5% | Slightly under-represented |
| Asian Background | 4.5% | 1.4% | -3.1% | Slightly under-represented |
| Other Ethnicity | 1% | 2.1% | +1.1% | Fairly represented |
10.3% of the survey sample said prefer not to say – had these people felt confident to share their demographics, the representativeness may have changed.
| Age | Census 2021 data* | Survey Sample | % Difference | Representativeness |
|---|---|---|---|---|
| 16-24 | 12% | 2.1% | -9.9% | Under-represented |
| 25-34 | 16.5% | 6.5% | -10% | Under-represented |
| 35-44 | 16.7% | 12.5% | -4.2% | Slightly under-represented |
| 45-54 | 17.4% | 16.3% | -1.1% | Fairly represented |
| 55-64 | 15.5% | 20.4% | +4.9% | Slightly under-represented |
| 65-74 | 12.2% | 22.7% | +10.5% | Over-represented |
| 75+ | 9.7% | 10.1% | +0.4% | Fairly represented |
*these are the percentages of the age groups that make up the population once all people under 16 have been removed, as we did not survey under 16s.
9.4% of the survey sample said prefer not to say- had these people felt confident to share their demographics, the representativeness may have changed.
Demographic differences
Northamptonshire Fire and Rescue Service
How good a job do you think Northamptonshire Fire and Rescue are doing?
- No significant differences between genders.
- No significant differences based on age.
- There were not big differences between ethnicities. 71.4% of those with a Black background ethnicity said they think NFRS do a good/excellent job, 69.0% of white British did, 68.4% of white other did. 63.6% of those with a Mixed ethnicity thought NFRS do a good/excellent job whilst 61.9% of those with an Asian ethnicity did. Consider small sample sizes for some groups.
- Those who selected prefer not to say to their demographics were less likely to say NFRS do a good job.
Council Tax Consultation
- No differences between genders.
- Older age groups were slightly more likely to say they would pay an increase than the younger age groups (except the 19-24 age category).
- Those of white British and Black ethnicities were most likely to say they would pay an increase (70.1% and 71.4% respectively). 63.6% of Mixed ethnicity background said they would and 57.9% or White other, 42.9% of Asian ethnicity said they would. Consider small sample sizes for some groups.
- Those who selected prefer not to say to their demographics were less likely to say they would be happy to pay the increase.
Northamptonshire Police
How good a job do you think Northamptonshire Police are doing?
- Females were more likely to say the Police do a good or excellent job (48.3%) than males (36.3%).
- No pattern based on age.
- Black and Mixed ethnicities were most likely to say the police do a good or excellent job (57.1% and 54.5% respectively). 47.6% of Asian ethnicities thought they do a good/excellent job. White British and White Other were least likely to think the police do a good job (41.6% and 42.1% respectively). Consider small sample sizes for some groups.
- Those who selected prefer not to say to their demographics were less likely to say the police do a good job.
Council Tax Consultation:
- Females were more likely to say they would pay an increase (61.3%) than males (49.4%).
- The older the age group, the more likely people were to say they would pay an increase.
- Those who selected prefer not to say to their demographics were less likely to say they would be happy to pay the increase.
- Those of an Asian background and white other background were least likely to say they would be willing to pay more (33.3% and 38.6%). White British and Mixed ethnicity were in the middle (56.1% and 54.5%), and those with a Black Background were most likely to say they would pay an increase (71.4%). Consider small sample sizes for some groups.
Public Confidence questions:
- Females were more likely to say they have confidence in the police (52.84%) than males (42.2%).
- No pattern based on age.
- Those with a Mixed and Black Ethnicity were most likely to indicate confidence (63.6% and 57.1% respectively). This was followed by White British and White other (47.6% and 45.6% respectively. Those with an Asian background were least likely to indicate confidence (25.0%).
- Those who selected prefer not to say to their demographics were less likely to say they have confidence in the police.
Victims of crime
- Those who had been a victim of crime in the last 12 months were less likely to say they would pay in increase (36.1%) than those who were not a victim (55.4%).
- Victims of crime were less likely to say the police do a good job (21.2%) than those who were not (44.3%).
- They were also less likely to have confidence (26.7%) thank those who were not victims (49.3%).